The exhibitor analytics will help you to get an overview of the activity within the exhibitor booths.
Exhibitor Analytics
Go to “Analytics” on the menu to the left, and click on “Exhibitor Analytics”.
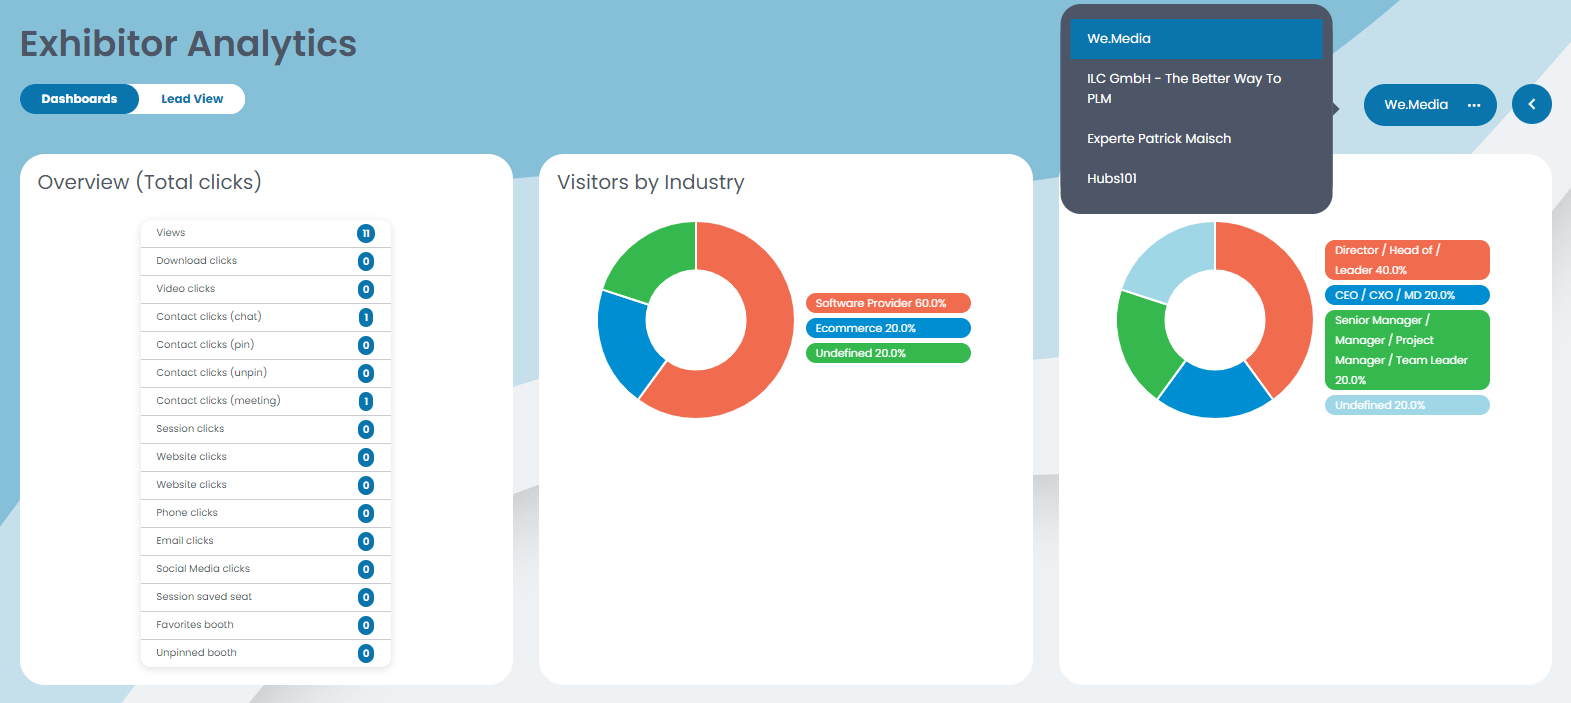
The exhibitor analytics shows you different data based on the activities within the exhibitor booths. Choose a booth on the right and the analytics will show on the dashboard.
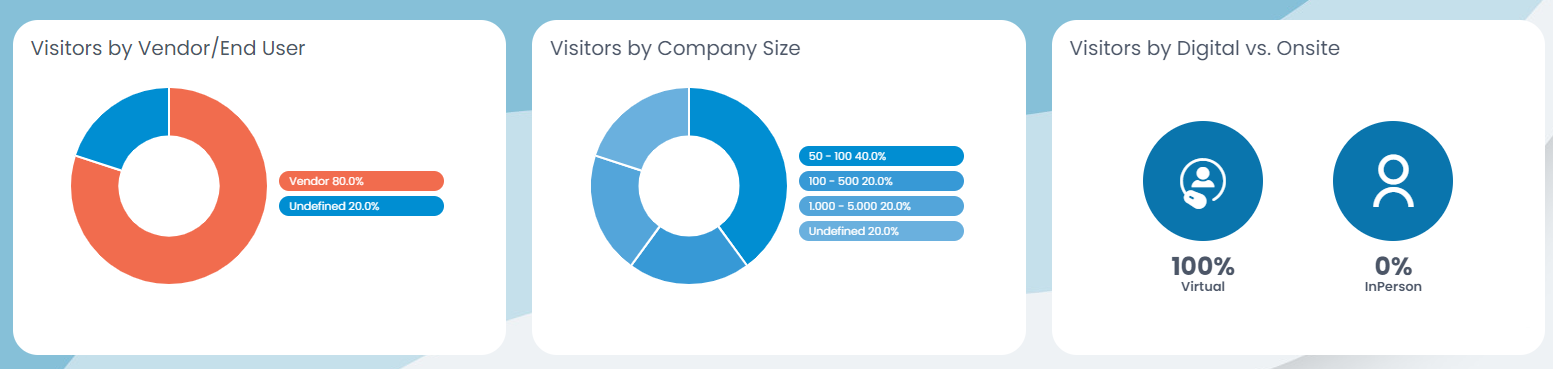
On the dashboard you can take a look at the overview of the booth, meaning the overall clicks. You can also see which attendees had interest in which booths, based on the attendees industry, job level, role, company size, etc.
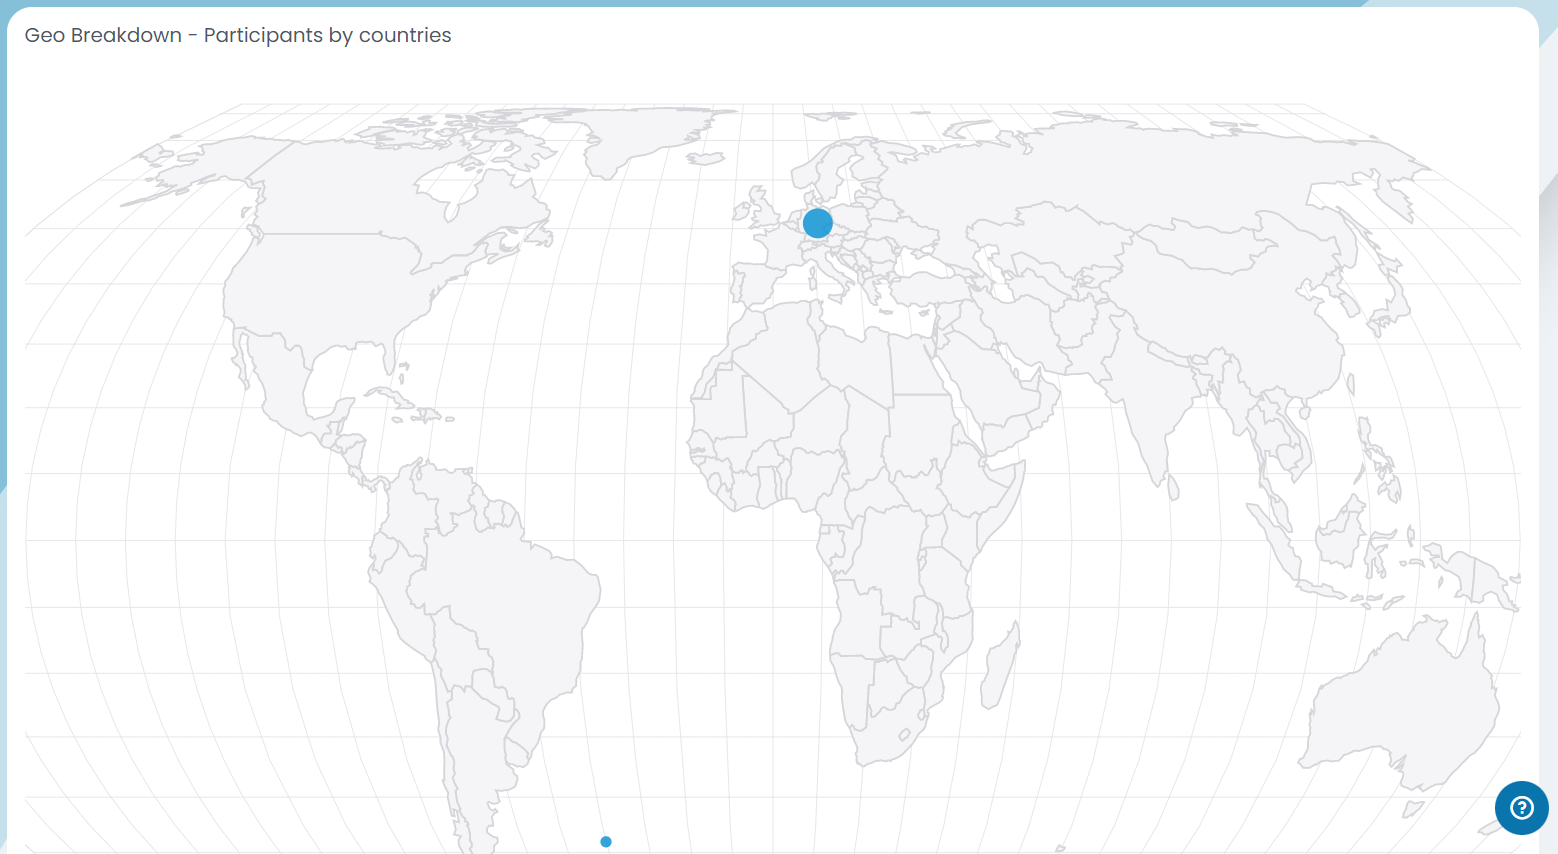
Furthermore you can view from which country the interseted attendees are participating from with the help of our interactive map.
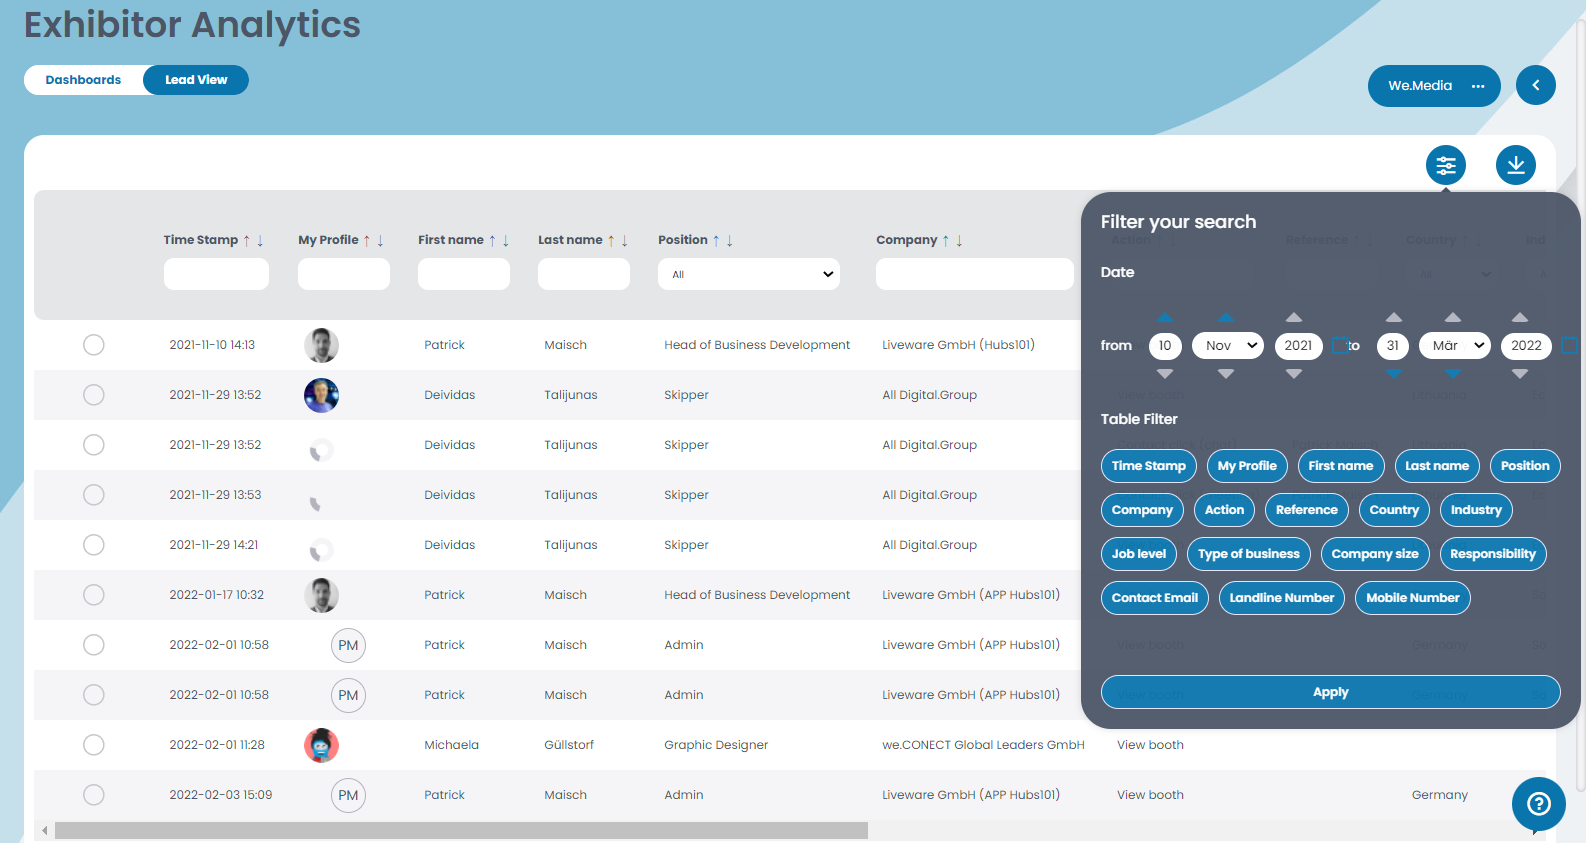
If you wish to have a more detailed view of the booth and its visitors you can go to “Lead View” at the top and a list will appear. The list shows all the important information of the attendees that visited the booth. You may filter the list if you only wish to see specific attendees.
The list may be exported by clicking on the arrow pointing down.